A map of Europe’s carbon emissions in 2020 Courtesy of Zhu Liu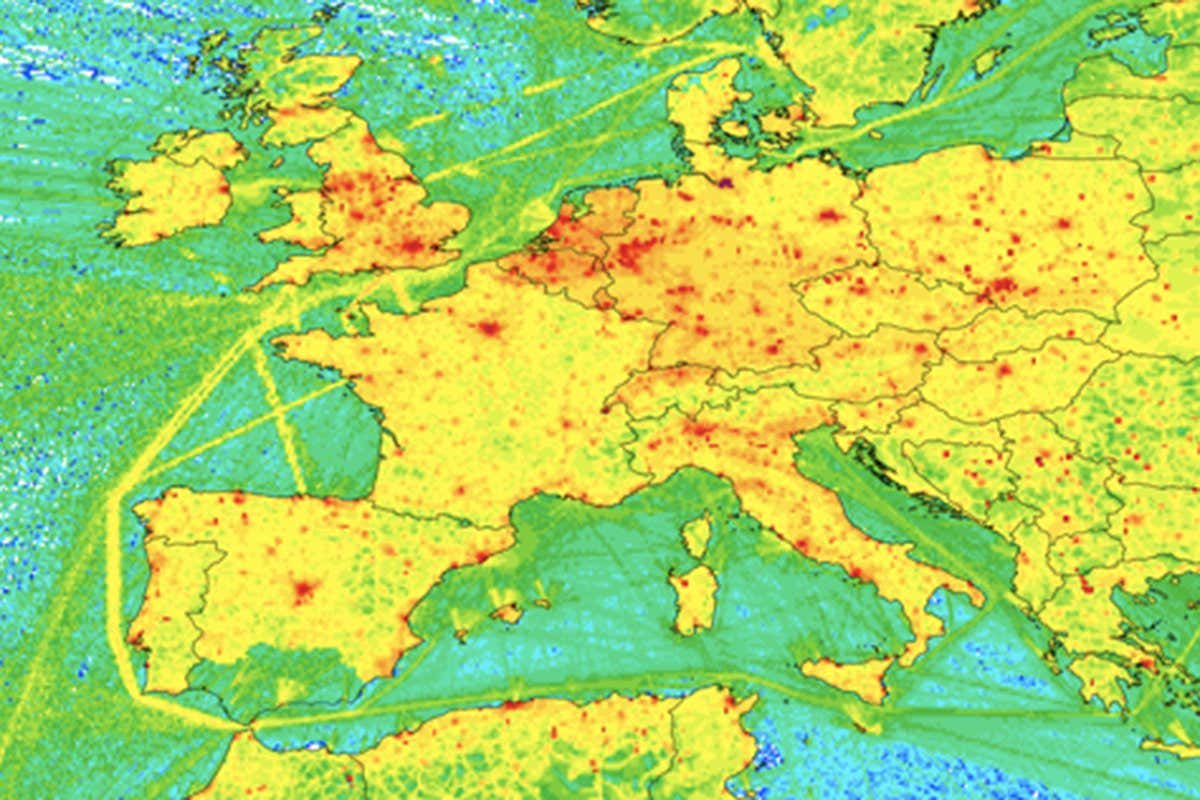
High-resolution maps of carbon emissions have revealed how our day-to-day patterns of behaviour, such as commuting, affect the release of greenhouse gases, and could help governments quickly see the impact of green policies.
Zhu Liu at Tsinghua University in Beijing, China, and his colleagues combined data from various sources to provide daily global maps of carbon emissions at a 10-kilometre resolution.
The researchers used country level emission inventories, data from industrial sites and power plants, satellite measurements of nitrogen dioxide and modelling estimates.
This allowed them to assess…